Spectral Mismatch Correction Factor a* / F*
Content
2 Why is a* correction necessary?
2.3 Measurement implementation
4.1. The X14 UV Erythema broadband radiometer
4.2. Examples of different a*a*act,R,Z correction values
1 Short description
The following is a description of the theoretical fundamentals of measurement value correction using the spectral mismatch factor a*. The commonly used notation F* represents the inverse of a*. Sometimes a* is also called a(Z), in the CIE 220 it is called a*act,R,Z and in the CIE S023 and ISO/CIE 19476 a*(Sz(λ)) [3],[8]).
The application of this correction factors allows a measurement value correction for the spectral mismatch compensation of spectrally selective receivers (e.g. photodiodes). This implies the compensation of errors in the expected nominal weighting function compared to the actual weighting function (e.g. V(λ)),ensuring improved measurement accuracy. The a* factors are calculated in relation to the spectral information of the measurement object, the calibration lamp and weighting functions.
For illustrative purposes, photometric measurements will be performed using the BTS256 LED tester. The Bi-Tec technology of the BTS256 LED tester allows real-time correction. An additional application shows how a correction can be performed for Erythema measurements by using a radiometer. Measurements with the X14 Erythema broadband radiometer will be used as examples. As no spectral measurements are performed in this case, the correction must be performed in a different manner. Gigahertz-Optik therefore stores spectral data from light sources in the device, with which corrections can still be performed.
2 Why is a* correction necessary?
2.1 Basics
For a photodiode to exhibit a desired spectral responsivity, special optical filters must often be developed. Their purpose is to match the spectral responsivity curve of the entire diode/filter/diffusor to the desired nominal responsivity curve. This is how for instance in photometry, the V(λ) function is realized using filters to emulate the spectral responsivity of the human eye. Here, V(λ) describes the spectral responsivity of the human eye in daylight conditions [1]
As the matching is subject to production tolerances, the resulting actual function is normally not an absolute match to the nominal function, resulting in deviations in the measurement readings. The products are therefore categorized into different quality classes depending on the degree of deviation, e.g. as per DIN 5032-7: f1‘≤2% = class L, ≤3% = class A, ≤6% = class B, ≤9% = class C [4].
In order to make an accurate statement concerning the quality of the measuring devices, the spectral data of the filters must be known. In Gigahertz-Optik, each individual filter as well as the overall system is spectrally measured and checked. This ensures exceptional quality and simultaneously provides data which is fundamentally necessary for a precise a* correction (in the following the a* is called a*act,R,Z).
In this correction, the measurement readings on the integral detector (generic term for photometric or radiometric measurement head) are divided with the a* factor (or multiplied with the factor F*). In doing this, the error between the spectral deviating weighting functions is corrected. The difference in area between not optimized actual and nominal function can be clearly illustrate by the example in figure 1.

Fig. 1 – Left: Nominal vs. actual V(λ) curve. Right: Difference between the two functions
The left figure shows the spectral mismatch clearly. From the right figure, it is apparent that the mismatch is wavelength-dependent. This representation is only an example from one measurement device; the error will in other devices be characterized by a different spectral curve due to the aforementioned filter tolerances.
2.2 Mathematical description
In order to calculate the a*act,R,Z factor, the actual and nominal weighting functions as well the calibration lamp spectrum and the spectrum of the measurement device are set into relation with each other [3].
This translates to:

| sact,Z | Effective sensitivity of the measurement head under consideration of the light source |
| sact,R | Effective sensitivity of the measurement head under consideration of the calibration source |
| Xλ,R,rel(λ) | Relative spectral power distribution of the calibration source |
| Xλ,Z,rel(λ) | Relative spectral power distribution of the light source |
| srel(λ) | Relative spectral sensitivity of the radiation head |
| Aact(λ) | Relative spectral power distribution of the ideal weighing function of the measurement head |

Fig. 2 – Graphical representation - a*act,R,Z part 1 and 2
1: The spectrum of the calibration lamp (blue) evaluated with the nominal V(λ) function (red). More specifically, it is convoluted with the nominal function. The red region displayed on the lower graph is the integral.
2: The measurement spectrum (in this case of an LED) evaluated with the V(λ) function (green).
 Fig. 3 – Graphical representation a*act,R,Z part 3 and 4
3: The calibration lamp (blue) evaluated with the actual V(λ) function (green)
4: The measurement (blue) evaluated with the nominal V(λ) function (red).
These four factors are calculated in relation to each other and together they represent the a*act,R,Z correction factor.
Info: This procedure is shown in a more demonstrative way in the appendix to evaluate the impact of this error source to the application. A more ease mathematical presentation has been chosen.
2.3 Measurement implementation
A spectrum, for instance that of an LED, can be measured using a spectral radiometer, the a*act,R,Z correction factor calculated and the measurement values corrected. This is possible when the spectrum of the calibration lamp, the nominal V(λ) curve and the actual V(λ) curve are known.
To simplify this entire process, Gigahertz-Optik has come up with measurement devices that incorporate the so called Bi-Technology Light Sensors (BTS). These consist of a photodiode for the integral and a CCD or CMOS array for spectral measurement. The conjunction of these two sensor technologies opens a lot of advantages for the measurement of photometric parameters. It makes it possible to measure as a mere photometer, furthermore it is possible to determine the spectrum of the measurement device, as a complete spectrometer is also incorporated.
The advantage here is that the a*act,R,Z correction can already be performed in real time, where the integral measurement value is determined using the diode while the spectrum is recorded simultaneously with the array. The nominal V(λ) curve, the actual V(λ) curve and calibration lamp spectrum are saved in the measuring device so that direct calculation of the a*act,R,Z correction factor can be done, thereby enabling real-time correction of the readings.
Schematic drawing of the Bi-Tec Sensors (BTS):

Fig. 4 – schematic drawing of the BTS
As a result of this correction, only minimal deviations in the measurement values occur. These depend only on how precise the a*act,R,Z correction factor is which is in turn dependent on the spectral precision of the measurement and the data used in the calculation.
Another advantage is that the corrected measurement reading can be used to scale the measured spectrum. This means that the non-linearity of the CCD or CMOS array can be scaled absolutely using an extremely linear photodiode.

Fig. 5 – Measurement with and without a*act,R,Z correction of the red LED // measurement device 2
3 Photometry
3.1 The BTS256-LED tester
The BTS256-LED tester is one of the measurement devices with a Bi-Technology Sensor (BTS). As already mentioned in the previous chapter, this enables both spectral and integral measurements.
The LED tester was developed by Gigahertz-Optik to measure on-board LEDs, for example. Due to its compact dimensions, it can be effectively implemented in both mobile and laboratory equipment. The working concept of the device is to bring the measuring instrument to the device
under test and not the other way round. This enables the user to assess the LEDs under the normal operation conditions.
The BTS256-LED tester is equipped with a small integrating sphere whose surface is made of the robust ODM98 material of type OP. DI. MA. The material has outstanding diffuse dispersion properties. To avoid staining, the opening is equipped with a 3-D window. The conical shape of the adapter enables the device to be directly positioned over the LED.
The conical adapters are available in different sizes so as to match with the geometry of the LEDs being measured.
White LEDs, which serve as an auxiliary lamp, are integrated to compensate for the substitution effect, making it possible to directly determine the correction factor of the test subject on the circuit board, e.g. using the S-BTS256 software [2].

Fig. 6 – BTS256-LED tester - three different conical adapters
3.2 Measurement Example
Measurement process: The LED is switched on and set to a constant working temperature (constant working conditions) using a current regulating power supply. The BTS256 LED tester is manually held over the LED to be measured, which should be positioned exactly at the opening of the conical adapter. The measurement program of the BTS256 LED tester is started and the device held still over the LED. The BTS256 LED tester can then be removed after the measurement is completed. While measuring, data is collected for both activated and deactivated a*act,R,Z correction factor. Upon deactivation of the a*act,R,Z correction factor, the software automatically sets this factor to 1 and no correction follows.

Fig. 7 – onboard measurement of the LED
Before both example measurements, substitution correction was performed [2]. This describes the effect which may result from the extra signal relative to the sphere calibration caused by reflection due to some covering of the sphere opening by the measurement object. The substitution correction hereby compensates for this induced error.
The example measurement was carried out using 5 different color LEDs and two different BTS256 LED testers. As a result, the following a*act,R,Z correction factors were recorded:
| Measurement | LED color | a*act,R,Z correction factor using device 1 | a*act,R,Z correction factor using device 2 |
| 1 | Blue | 1.0027 | 1.1157 |
| 2 | Green | 0.9873 | 1.0024 |
| 3 | White | 0.9997 | 1.0127 |
| 4 | Yellow | 1.0024 | 0.9764 |
| 5 | Red | 1.0847 | 1.0876 |
Based on these measurements, it is clear that the a*act,R,Z correction factor varies from device to device. Furthermore, it is evident that the spectral distribution of the measurement object is influential as well.
The deviation of the different devices results from varying filter tolerances. Depending on the measuring device, the actual curves spectrally vary from each other within a certain tolerance. This makes it necessary to always determine a new a*act,R,Z correction factor for each light source.
To clearly illustrate the spectral mismatch effect, the difference function between the actual and nominal V(λ) function can be multiplied with the spectral measurement. In doing so, it can be noted that some regions are weighted too strong whereas others are weighted too weak. If they in turn cancel each other out, it means that the spectral mismatch factor is approximately equal to one (this representation is only for illustrative purposes and is not a mathematical description).
The third measurement (white LED) with measuring device 1 shows a minimal error of 0.03%. The representation in figure 8 shows that the areas above and below the 0 axis somehow cancel each other out.

Fig. 8 – Simplified representation - white LED // measuring device 1
In the fifth measurement (red LED), an error of 8% is shown. This is also reflected in the diagram as the entire area is below the axis.

Fig. 9 – simplified representation - red LED // Measuring device 1
The first measurement (blue LED) with device 1 shows an error of 0.27%. The under- and overvaluations also almost cancel each other out in this case as well.
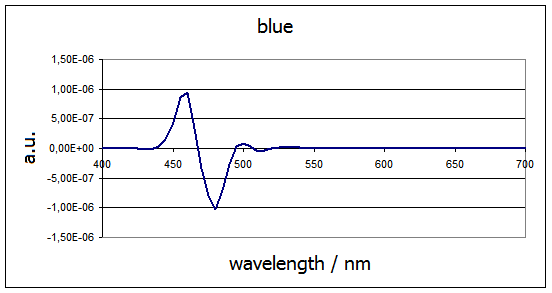
Fig. 10 –  // Measuring device 1
Generally, large deviations result where the spectra are rather narrow e.g. narrow band LEDs or lasers. These only cover a very small spectral range where unilateral weightings result more easily. In such cases, a*act,R,Z correction is distinctly necessary for precise measurements.
4 Erythema
Erythema measurement entails analysis within the UV range. UV radiation is one of the greatest cancer risks. Legislature hence strives to reduce the risk from artificial UV radiation by implementing the Federal UV Radiation Protective Directive (e.g. the UVSV of the german council [7]). For UV radiation devices, this is done by limiting the maximum UV radiation. UV measurement devices are thus used so as to abide to the required guidelines as outlined by the UV Radiation Protective Directory. The devices have to be characterized according to CIE220 [3].
The Erythema weighting function is a great challenge for manufacturers of measurement devices. One of the reasons for this arises from the limited number of ideal optical filters for applications dealing with UV radiation. Additionally, many substrates greatly absorb below 350 nm. As a result, due to limited freedom in filter design, large errors occur while performing the spectral match to the weighting function. For this reason, a*act,R,Z correction is of utmost important in these applications [5,6].

Fig. 11 – nominal and logarithmic curves on a logarithmic scale
4.1 The X14 UV Erythema broadband radiometer
The X14 broadband radiometer is a UV measurement device consisting of a display device and an XD-45-ERYC-4 measurement head. It was developed by Gigahertz-Optik for UV radiation measurements as outlined in the UV Radiation Protection Act.
The X14 display device is based on a signal amplifier in the form of a current- voltage transducer with multiple switchable gain levels and runs on two regular AA batteries.
The UV Erythema measurement head consists of three UV radiation detectors. It is used to measure the Erythema effective UV irradiance and ensure that UV- C radiation is not present. The irradiance is displayed in W/m2.
The Erythema sensor consists of two photodiodes, one for the UV-BC and the other for the UV-A range. The separation of the measurement ranges by the photodiodes reduces crosstalk, i.e. mutual interference between the two ranges. This construction principle enables the fabrication of UV Erythema measurement devices that only have a single UV radiation detector and at the same time guarantees significantly lower measurement uncertainty. The third radiation sensor is the UV-C sensor. It comprises of a spectral correction filter that suppresses interference by UV-B and UV-A radiation.

Fig. 12 – X14 with detector
For the a*act,R,Z correction, the spectrum of the light source being measured is required as it cannot be determined using a simple integral radiometer. Direct a*act,R,Z correction e.g. with the BTS256 LED tester is in this case not possible. There are however two possibilities for performing a*act,R,Z correction on the measurement results:
-
The radiation source being examined can be measured using an external spectrometer and an a*act,R,Z correction factor determined using the spectral responsivity data of the X14. This is however a very cumbersome method which requires the use of two devices. This method is therefore inconvenient for mobile applications.
-
Alternatively, Gigahertz-Optik has incorporated a*act,R,Z factors in its measuring devices for typical lamp types. These are determined directly after calibration at Gigahertz-Optik and stored in the device. The type of source can be chosen from the device menu and the readings can be internally corrected using the corresponding a*act,R,Z correction factor. This method is applicable for many measurement objects.
4.2 Examples of different a*act,R,Z correction values
As already mentioned in 3.4, the spectral responsivity adjustment in UV is essentially critical, making a*act,R,Z correction even more important. The following table shows several a*act,R,Z correction factors.
a* values in blue are out of the range from 0.5 up to 2 and set to 1.00 (= no correction possible)
a* values in green are within the range from 0.9 to 1.1
a* values in red are in the range from 0.8 up to 1.25
a* values in black are within the range from 0.9 to 1.1
are in the range from 0.5 up to 2
* ISSN 1456-2537 UVNEWS
The official newsletter of Thematic Network for Ultraviolet Measurement
Issue6 / November 2000 pages A-10f
| a*act,R,Z correction factor | |||
| UVC detector | UVB detector | UVA detector | |
| UVA source | |||
| UVA 370 20nm | 1.32 | 1.68 | 1.09 |
| UVA 365 2nm | 1.13 | 1.04 | 1.41 |
| UVA 365 20nm | 1.05 | 1.13 | 1.08 |
| UVA 365 25nm | 0.92 | 1.15 | 1.09 |
| UVA 365 30nm | 1.33 | 1.09 | 1.09 |
| UVA 365 35nm | 1.04 | 1.13 | 1.09 |
| UVA 355 35nm | 1.17 | 1.27 | 1.19 |
| UVA 350 40nm | 0.65 | 1.14 | 1.09 |
| UVA 350 50nm | 1.17 | 1.11 | 1.07 |
| UVA 340 55nm | 0.80 | 1.06 | 1.03 |
| UVB source | |||
| UVB 311 5nm | 1.02 | 1.10 | 1.00 |
| UVB 313 35nm | 0.81 | 1.00 | 1.00 |
| UVABC 01 | 1.25 | 1.01 | 0.96 |
| UVABC 02 | 1.09 | 1.02 | 0.93 |
| UVABC 03 | 1.26 | 1.01 | 1.03 |
| General UV source | |||
| U1 Xenon | 1.29 | 1.01 | 1.00 |
| U2 HMI | 1.08 | 1.02 | 1.01 |
| U3 Tanning | 1.00 | 1.16 | 1.10 |
| U4 Derma | 1.02 | 1.10 | 1.00 |
| U5 HG Low | 1.02 | 0.93 | 1.00 |
| U6 HG Medium | 0.70 | 1.07 | 1.70 |
| U7 Sun | 1.00 | 1.17 | 1.01 |
| U8 Deuterium | 1.00 | 1.38 | 1.02 |
| U9 Tungsten | 1.26 | 1.00 | 0.99 |
| U10 Iron Hig | 1.00 | 1.04 | 1.02 |
| Sun | |||
| Sun 0° C | 1.00 | 1.17 | 1.01 |
| Sun 15° C | 1.00 | 1.16 | 1.01 |
| Sun 30° C | 1.00 | 1.16 | 1.01 |
| Sun 45° C | 1.00 | 1.13 | 1.01 |
| Sun 60° C | 1.00 | 1.09 | 1.01 |
| Sun 70° C | 1.00 | 1.06 | 1.02 |
| Sun 75° C | 1.00 | 1.08 | 1.02 |
| Sun 80° C | 1.00 | 1.15 | 1.03 |
| Sun 85° C | 1.00 | 1.29 | 1.05 |
| Sun 89° C | 1.00 | 1.34 | 1.05 |
From the tables, it can be noted that measurement errors of about 20% are fairly common. This in turn shows how important a*act,R,Z correction in UV is.
5 Summary
In order to perform a high-precision measurement with a photodiode, the measurement reading must be corrected using the corresponding a*act,R,Z mismatch factor. This compensates for the spectral mismatch of photodiodes resulting from filter systems by mapping to the spectral nominal responsivity. Hereby, the measurement values of the integral detector are divided with the a*act,R,Z factor or multiplied by the F* factor.
In photometry, the V(λ) function is designed to emulate the human eye, describing its spectral responsivity in daylight [1]. By using different filters, the actual V(λ) function can be mapped onto the nominal V(λ) function quite accurately. In Erythema measurement, the filter adjustment is a great challenge especially as few optical filters are available for the UV range. As a result, large errors occur while performing the spectral match to the weighting function. The a*act,R,Z correction is therefore crucial in these applications.
In order to calculate the a*act,R,Z factor, the actual and nominal weighting functions as well the spectrum of both the calibration lamp and the measurement device are calculated in relation to each other. [3].
This translates to:

| sact,Z | Effective sensitivity of the measurement head under consideration of the light source |
| sact,R | Effective sensitivity of the measurement head under consideration of the calibration source |
| Xλ,R,rel(λ) | Relative spectral power distribution of the calibration source |
| Xλ,Z,rel(λ) | Relative spectral power distribution of the light source |
| srel(λ) | Relative spectral sensitivity of the radiation head |
| Aact(λ) | Relative spectral power distribution of the ideal weighing function of the measurement head |
1: The spectrum of the calibration lamp is evaluated with the nominal function for every wavelength.
2: The spectrum of the measurement evaluated with the actual function.
3: The calibration lamp evaluated with the actual function.
4: The measurement evaluated with the nominal function.
In the photometric measurement using the BTS256 LED tester, the integral measurement value is determined using the photodiode. The spectrum is recorded simultaneously with the spectrally resolving array. The nominal V(λ) curve, actual V(λ) curve and calibration lamp spectrum are saved in the measuring device so that direct online calculation of the a*act,R,Z correction factor and hence online correction of the readings can be performed.
Erythema measurement with the X14 radiometer entails mere measurement of an integral meaning that the spectrum of the light source can thereby not be determined and hence making it impossible to perform any real-time correction. There are however two alternative possibilities to do this:
-
The radiation source being examined can be measured with the aid of an external spectrometer and an a*act,R,Z correction factor determined using the spectral responsivity data of the X14. This method is however cumbersome and inconvenient for mobile applications.
-
Alternatively, Gigahertz-Optik has incorporated a*act,R,Z factors in its measuring devices for the typical lamp types. These are determined directly after calibration at Gigahertz-Optik and stored in the device. The type of source can be chosen from the device menu and the readings can be internally corrected using the corresponding a*act,R,Z correction factor. This method is applicable for many measurement objects.
According to this correction, only a very small measurement uncertainty remains. The size of this uncertainty mainly depends of the quality of the assessment of the a*act,R,Z correction factor. This factor depends on the quality of the measurement of the needed quantities.
Hence it is necessary to know all relative spectral data/sensitivities of the measurement device to perform a precise measurement. This is the reason why manufacturers should provide relative spectral sensitivities of their detectors to the customers (this for each detector, since they underlie fabrication tolerances). Only by knowing this data can be compensated.
6 References
[1] ISO/CIE 10527(E) joint ISO/CIE standard: Colorimetric observers, 1991 (S002, 1986)
[2] Gigahertz-Optik: Wozu dient die Substitutionskorrektur? 2013 - Fachartikel
[3] CIE 220:2016: Characterization and Calibration Methods of UV Radiometers., Wien: CIE, 2016
[4] DIN 5032-7 Lichtmessung Klasseneinteilung von Beleuchtungsstärke- und Leuchtdichtemessgeräten.. Berlin: Beuth, 1985 [5] IN 5050-1 Solarien und Heimsonnen. D. Berlin: Beuth, 1992
[6] DIN 60335-2-27. Sicherheit elektrischer Geräte für den Hausgebrauch und ähnliche Zwecke. Berlin: Beuth, 1997
[7] UVSV Verordnung zum Schutz vor schädlichen Wirkungen künstlicher ultravioletter Strahlung: UV-Schutz-Verordnung vom 20. Juli 2011 (BGBl. I S. 1412)
[8] ISO/CIE 19476(E) joint ISO7CIE standard: Characterization of the performance of illuminance meters and luminance meters, (S023, 2014)
7 Appendix
For a simplified explanation of the formula of CIE 220:2016 it is rearranged in the following. Instead of a compound fraction a multiplication has been chosen.
According to CIE 220:2016:

Rearranged:

| sact,Z | Effective sensitivity of the measurement head under consideration of the light source |
| sact,R | Effective sensitivity of the measurement head under consideration of the calibration source |
| Xλ,R,rel(λ) | Relative spectral power distribution of the calibration source |
| Xλ,Z,rel(λ) | Relative spectral power distribution of the light source |
| srel(λ) | Relative spectral sensitivity of the radiation head |
| Aact(λ) | Relative spectral power distribution of the ideal weighing function of the measurement head |
This formula can be simplified for illustration purposes in an intellectual game. This writing is mathematical spoken not correct, however it helps understanding the process.

With this R, Z, A and S the following examples are calculated. These examples will show that by an equal detector the calibration source will be very important.
For illustration purposes three different spectral power distributions have been chosen. A line function with weighting 1 by one wavelength, a radiometric rectangle function with weighting 1 in a defined wavelength range and 0 outside this range, a triangular function with peak 1.
| nm | line function | rectangular function | triangular function |
| 200 | 0 | 0 | 0 |
| 250 | 0 | 1 | 0 |
| 300 | 0 | 1 | 0.5 |
| 350 | 1 | 1 | 1 |
| 400 | 0 | 1 | 0.5 |
| 450 | 0 | 1 | 0 |
| 500 | 0 | 0 | 0 |

Multiplying these functions with each other at each wavelength results in:
| nm | line function * rectangular function | triangular function * rectangular function | line function * triangular function |
| 200 | 0 | 0 | 0 |
| 250 | 0 | 1 | 0 |
| 300 | 0 | 1 | 0.5 |
| 350 | 1 | 1 | 1 |
| 400 | 0 | 1 | 0.5 |
| 450 | 0 | 1 | 0 |
| 500 | 0 | 0 | 0 |

| nm | rectangular function * rectangular function | triangular function * triangular function | line function * line function |
| 200 | 0 | 0 | 0 |
| 250 | 0 | 0 | 0 |
| 300 | 0 | 0.5 | 0 |
| 350 | 1 | 1 | 1 |
| 400 | 0 | 0.5 | 0 |
| 450 | 0 | 0 | 0 |
| 500 | 0 | 0 | 0 |

With this knowledge some example calculations can be performed:
In example 1 the relative spectral distribution of the used calibration source (R) is a line, the spectral distribution of the light source to measure (Z) is a triangle, the relative spectral distribution of the weighing function (A) is a rectangle, the relative spectra sensitivity of the measurement head (S) is a triangle.
| EXAMPLE 1 | R=calibration source | S=detector responsivity | A=weighting function | Z=measurement source |
| nm | line function | triangular function | rectangular function | triangular function |
| 200 | 0 | 0 | 0 | 0 |
| 250 | 0 | 0 | 1 | 0 |
| 300 | 0 | 0.5 | 1 | 0.5 |
| 350 | 1 | 1 | 1 | 1 |
| 400 | 0 | 0.5 | 1 | 0.5 |
| 450 | 0 | 0 | 1 | 0 |
| 500 | 0 | 0 | 0 | 0 |

The following tables show the values of the single parts of the formula:

| EXAMPLE 1 | R=calibration source | A=weighting function | R=calibration source * A=weighting function |
| nm | line function | rectangular function | line function * rectangular function |
| 200 | 0 | 0 | 0 |
| 250 | 0 | 1 | 0 |
| 300 | 0 | 1 | 0 |
| 350 | 1 | 1 | 1 |
| 400 | 0 | 1 | 0 |
| 450 | 0 | 1 | 0 |
| 500 | 0 | 0 | 0 |
| Integral = sum of all wavelength dependent contributions | 1 |
| EXAMPLE 1 | Z=measurement source | S=detector responsivity | Z=measurement source * S=detector responsivity |
| nm | triangular function | triangular function | triangular function * triangular function |
| 200 | 0 | 0 | 0 |
| 250 | 0 | 0 | 0 |
| 300 | 0.5 | 0.5 | 0.25 |
| 350 | 1 | 1 | 1 |
| 400 | 0.5 | 0.5 | 0.25 |
| 450 | 0 | 0 | 0 |
| 500 | 0 | 0 | 0 |
| Integral = sum of all wavelength dependent contributions | 1.5 |
| BEISPIEL 1 | R=calibration source | S=detector responsivity | R=calibration source * A=weighting function |
| nm | line function | triangular function | line function * triangular function |
| 200 | 0 | 0 | 0 |
| 250 | 0 | 0 | 0 |
| 300 | 0 | 0.5 | 0 |
| 350 | 1 | 1 | 1 |
| 400 | 0 | 0.5 | 0 |
| 450 | 0 | 0 | 0 |
| 500 | 0 | 0 | 0 |
| Integral = sum of all wavelength dependent contributions | 1 |
| BEISPIEL 1 | Z=measurement source | A=weighting function | Z=measurement source * A=weighting function |
| nm | triangular function | rectangular function | triangular function * rectangular function |
| 200 | 0 | 0 | 0 |
| 250 | 0 | 1 | 0 |
| 300 | 0.5 | 1 | 0.5 |
| 350 | 1 | 1 | 1 |
| 400 | 0.5 | 1 | 0.5 |
| 450 | 0 | 1 | 0 |
| 500 | 0 | 0 | 0 |
| Integral = sum of all wavelength dependent contributions | 2 |

By a calibration of the measurement head with a line lamp the measured value of the light source will be too small. The measurement has to be divided by 0.75 for correcting the spectral mismatch!
In example 2 as a calibration source (R) a rectangular function instead of a line function is used, following in:
The relative spectral distribution of the used calibration source (R) is a rectangular, the spectral distribution of the light source to measure (Z) is a triangle, the relative spectral distribution of the weighing function (A) is a rectangle, the relative spectra sensitivity of the measurement head (S) is a triangle.
| EXAMPLE 2 | R=calibration source | S=detector responsivity | A=weighting function | Z=measurement source |
| nm | rectangular function | triangular function | rectangular function | triangular function |
| 200 | 0 | 0 | 0 | 0 |
| 250 | 1 | 0 | 1 | 0 |
| 300 | 1 | 0.5 | 1 | 0.5 |
| 350 | 1 | 1 | 1 | 1 |
| 400 | 1 | 0.5 | 1 | 0.5 |
| 450 | 1 | 0 | 1 | 0 |
| 500 | 0 | 0 | 0 | 0 |
| EXAMPLE 2 | R=calibration source | A=weighting function | R=calibration source * A=weighting function |
| nm | rectangular function | rectangular function | rectangular function * rectangular function |
| 200 | 0 | 0 | 0 |
| 250 | 1 | 1 | 1 |
| 300 | 1 | 1 | 1 |
| 350 | 1 | 1 | 1 |
| 400 | 1 | 1 | 1 |
| 450 | 1 | 1 | 1 |
| 500 | 0 | 0 | 0 |
| Integral = sum of all wavelength dependent contributions | 5 |
| EXAMPLE 2 | Z=measurement source | S=detector responsivity | Z=measurement source * S=detector responsivity |
| nm | 0 | triangular function | 0 * triangular function |
| 200 | 0 | 0 | 0 |
| 250 | 0 | 0 | 0 |
| 300 | 0.5 | 0.5 | 0.25 |
| 350 | 1 | 1 | 1 |
| 400 | 0.5 | 0.5 | 0.25 |
| 450 | 0 | 0 | 0 |
| 500 | 0 | 0 | 0 |
| Integral = sum of all wavelength dependent contributions | 1.5 |
| EXAMPLE 2 | R=calibration source | S=detector responsivity | R=calibration source * A=weighting function |
| nm | rectangular function | triangular function | rectangular function * triangular function |
| 200 | 0 | 0 | 0 |
| 250 | 1 | 0 | 0 |
| 300 | 1 | 0.5 | 0.5 |
| 350 | 1 | 1 | 1 |
| 400 | 1 | 0.5 | 0.5 |
| 450 | 1 | 0 | 0 |
| 500 | 0 | 0 | 0 |
| Integral = sum of all wavelength dependent contributions | 2 |
| BEISPIEL 2 | Z=measurement source | A=weighting function | Z=measurement source * A=weighting function |
| nm | triangular function | rectangular function | triangular function * rectangular function |
| 200 | 0 | 0 | 0 |
| 250 | 0 | 1 | 0 |
| 300 | 0.5 | 1 | 0.5 |
| 350 | 1 | 1 | 1 |
| 400 | 0.5 | 1 | 0.5 |
| 450 | 0 | 1 | 0 |
| 500 | 0 | 0 | 0 |
| Integral = sum of all wavelength dependent contributions | 2 |

By a calibration of the measurement head with a lamp with a rectangular spectral distribution the measured value of the light source will be too large. The measurement has to be divided by 1.875 for correcting the spectral mismatch!
This two examples show, that dependent on the calibration procedure the measurement results will be different by the same detector. Both calibration procedures are valid and often used! Only after applying the spectral mismatch correction factor both measurements will give the same results. In the presented example the difference without correction is a factor of 2.5! It is necessary to know all the spectral data to correct the measurement data by the spectral mismatch correction to get precise data. This is why manufacturers should provide relative spectral data of their detectors so that operators are able to correct for this measurement uncertainty.