Overview of effects of stray light as well as ways to reduce it in array spectrometers/array spectroradiometers
Contents
1. Short description
This article focuses on giving an overview of the causes of stray light, its effects on the measurement accuracy of spectroradiometers, and the different methods of stray light suppression. It provides a detailed description of the different stray light suppression requirements for different applications.
Note: The term spectroradiometer is used regularly in the article. A spectroradiometer is a radiometrically calibrated spectrometer and its function is based on relative measurements.
2. Introduction
Stray light discussed here, also known as “false” light, is signal that is detected during a spectrometer measurement additional to the measurement signal dedicated for the selected wavelength ranges. These signals cannot be separated and thus the stray light considerably distorts the measurement result. The amount of stray light in a measurement strongly depends on the light source and the spectrometer itself. Inside a spectrometer unit, stray light can originate from:
- Scattering at the optical diffraction grating (grooved gratings)
- Interfering of the 0th order of the optical diffraction grating
- Appearance of higher orders of the optical diffraction grating
- inter-reflections between mirrors, detector, grating, entrance slit, housing
- diffuse reflection of optically imperfect surfaces
- etc.
The figure below shows a halogen lamp measurement with and without a Schott GG475 edge filter using a spectroradiometer.
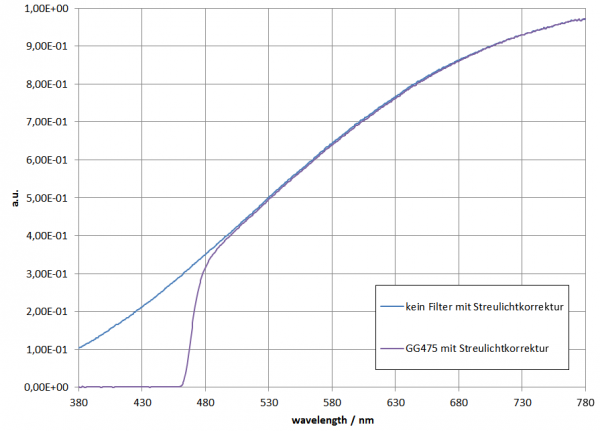
Figure 1: Halogen lamp measurement filtered with/without a GG475 (linear view)
Since the GG475 filters out the signal in the short-wave spectral range below 475 nm, one can conclude that the signal detected below the edge is caused by stray light + noise. Since this is difficult to identify using a linear scale, the logarithmic view is recommended. The ideal filter function is shown in green.
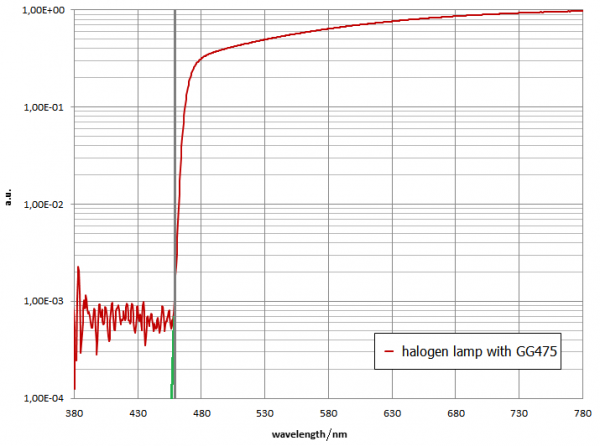
Figure 2: Halogen lamp measurement filtered with the GG475 (logarithmic view)
This means that in this measurement the strong broadband signal from the halogen lamp, at wavelengths above 475 nm, produced little stray light below 475 nm. The signal detected in this wavelength therefore consists of the stray light and noise.
In comparison, Figure 3 shows measurement data for a similar scenario (an OG515 filter is used instead of GG475) but using a measurement device that is less optimized for stray light suppression. It can be seen that the amount of stray light is significantly higher, even though there is actually less potential for stray light in this case since the OG515 filter is more effective than the GG475. This poorer stray light suppression has a negative effect on the measurement accuracy for this type of measurement including, for example, chromaticity values.
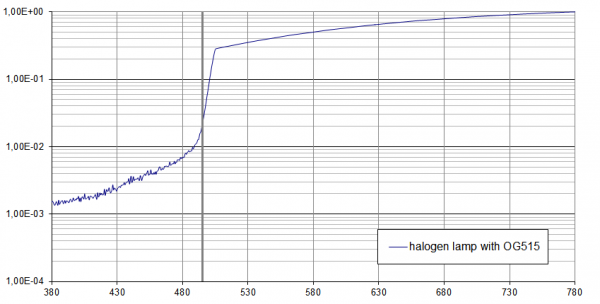
Figure 3: Halogen lamp measurement filtered with the OG515 (logarithmic view),
spectroradiometer not ideal for stray light suppression
However, if you compare these data with the measurement of a red LED (same spectroradiometer), you will see that in the measurement of the red LED, the stray light level below 475 nm (the red LED does not have a signal with this wavelength) is significantly lower (2E-5 for the LED compared to 6E-4 for the halogen lamp):
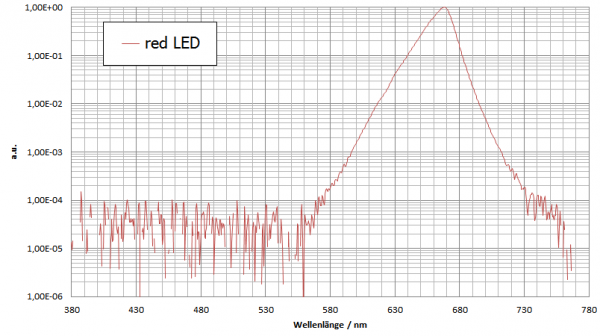
Figure 4: Measurement of a red LED
This means that the level of stray light also depends on the spectral distribution of the measurement light source being measured.
The reason an extra signal level is shown in addition to the LED peak in the LED measurement is not just because of the stray light but also due to the spectrometer’s noise. Here, a noise count of 1 for a 16 bit ADC means a 1:65536 dynamic range which corresponds to 6E-4. For a spectroradiometer, the basic measurement dynamic range achievable is limited by the resolution of the ADC and the signal-to-noise ratio. Ideally, the stray light level should be less than the ADC resolution.
This thus leads to the question: When is stray light significant in a measurement? Unfortunately, there is no general answer to this question. It depends on the application and the corresponding measurement requirements. Below are two guidelines that can be adhered to:
- The larger the dynamic range required, the more important it is to ensure sufficient stray light suppression. This is particularly essential if part of the relevant spectrum is characterized by a relatively weak signal. This is because the effect of stray light on the weak signal is much larger than on a strong signal. The accuracy of measurements in the UV region is often limited by stray light rather than instrument sensitivity or noise.
- The more complex a light source is in terms of its spectral distribution, the more important it is to ensure sufficient stray light suppression. The narrow spectral distribution of light sources such as lasers and monochromatic LEDs produce very little stray light in comparison withbroadband light sources like the sun, halogen lamps and white LEDs.
Stray light leads to measurement uncertainty and must be considered in thecalculation of measurement uncertainty as specified in CIE S025 or CIE 198. Since the amount of stray light is dependent on the spectral distribution being measured and the design of the spectrometer, the calculation must be performed for each particular spectroradiometer and measurement application.
Note: These calculations require several specification and characterizations of the spectroradiometer. In addition, models for calculating the measurement uncertainty in spectroradiometry are arbitrarily complex. Gigahertz-Optik GmbH is a reliable partner who offers you an ideal, quick solution fitting your requirements.
3. Methods of stray light suppression
This chapter describes in detail some ofthe different ways to reduce stray light in spectroradiometers.
3.1 Optical design
A prerequisite is a properly designed spectrometer unit. Optical simulations are often used to optimize modern spectroradiometers since the complexity of optical beam paths has to be carefully considered. Through such simulations, spectroradiometers can be optimized to meet the highest demands. For instance, the image sharpness must be optimized, the 0th order blocked, and higher orders removed diligently from the beam path towards the detector.
Besides the design, the choice of the optical components is also crucial. The quality of the mirror coating determines the proportion of diffusely reflected radiation and the resulting amount of stray light. Similarly, the quality of the optical grating is also crucial in minimizing stray light.
Note: Gigahertz-Optik has many years of experience in the development of spectrometers and optimizes its spectrometer units using ZEMAX. In addition, every unit must go through a long and thorough development and qualification process where all its optical elements and properties are tested and optimized.
3.2 Mathematical correction (stray light matrix)
Thanks to tunable lasers OPO optical parametric oscillator), spectrometers can be analyzed and characterized at any wavelength. Thus, LSFs (line spread functions) can be determined at each wavelength, which together form an SDF (signal distribution function) characterization matrix of the spectrometer. This means that the data collected from the measurements can be used to characterize the device and its stray light properties based onwavelength.
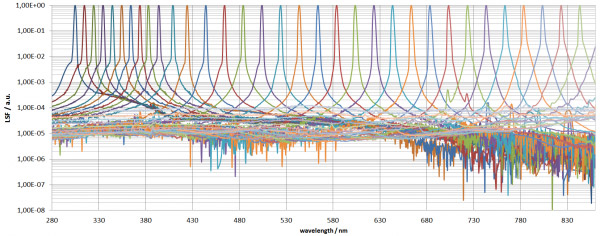
Figure 5: LSF of a spectroradiometer measured using an OPO
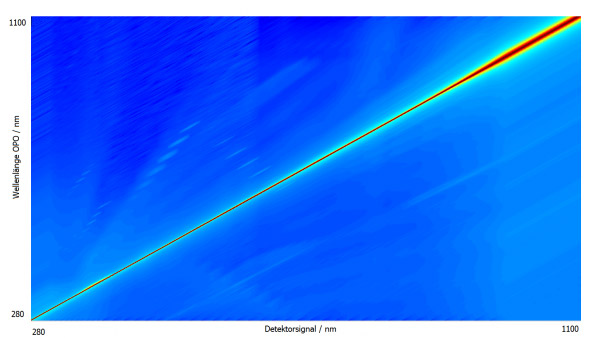
Figure 6: LSF matrix representation
With the SDF data and the measurement data from the light source being measured, mathematical correction methods according to (Zong et al., 2006) or (Nevas et al., 2012) can be used for the different applications. Here, the mathematical correction must be performed for every measurement, so a good software implementation is crucial. In addition, the manufacturer must have an OPO in order to perform the measurements precisely without excessive extrapolation and model assumptions. The spectroradiometer must also be stable (over time) for the stray light matrix to be valid over useful periods of time. If this is the case, the quality of the mathematical stray light correction can be described as follows. The level of stray light can be reduced by about 1 or 2 orders of magnitude as shown in the example below:
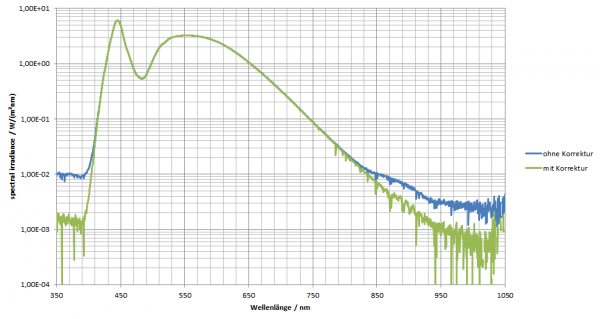
Figure 7: Mathematical stray light correction applied to a white LED measurement (green is corrected, blue is not)
Note: The (Nevas et al., 2012) method also performs an optical bandwidth correction. Alternatively, the (Zong et al., 2006) method can also be used and combined with the CIE 214 optical bandwidth correction. Gigahertz-Optik offers both methods.
However, this method has a limitation – the LSFs must be measured for the entire spectral range of the detector for optimal stray light suppression (i.e. the spectroradiometer should also cover this range). For silicon based detectors, this ranges from 200 nm to 1100 nm. If all functions are not measured, only part of the stray light will be corrected!
Note: Gigahertz-Optik offers stray light matrices for its high-end spectrometers from the BTS2048 Series as standard options. The mathematical application is completely integrated in the S-BTS2048 software as well as the S-SDK-BTS2048. The characterization and calibration data for the stray light correction are saved on the device for easy access by the user. No extra measures are required from the user.
3.3 Optical Filtering
A well-known method of stray light correction in the UV range is based on long-pass filters such as Schott GG435. The GG435 is used to perform an additional measurement during calibration where the amount of OoR stray light is directly determined. This signal can then be subtracted from the raw data and thus applied to the resulting calibration data. This method enables calibrations with reduced stray light influences but the subsequent measurement of other light sources may still have a different stray light influence.
An innovative way to optimize stray light suppression, particularly in the critical UV range, is combining a spectroradiometer with several optical longpass filters and bandpass filters within the device. Bandpass filters basically allow the approximation of a single array spectroradiometer to a double monochromator since the bandpass filter is significantly reducing the radiation entering the spectroradiometer and thus the potential for stray light generation. With the use of long pass filters the above described method can be applied during calibration and at each measurement.
Ideally, different filters must be used if a large spectral range is to be covered in order to ensure optimal stray light suppression. Implementing this requires an integrated fast filter wheel, extensive know-how about filter technology and powerful software since several individual measurement steps have to be intelligently combined to produce one final measurement. A user-friendly system requires that all these be implemented automatically by software.
Note: With this technology, Gigahertz-Optik GmbH developed one of the best optimized UV spectroradiometers for stray light suppression and that almost works as a perfect double monochromator – the BTS2048-UV-S.
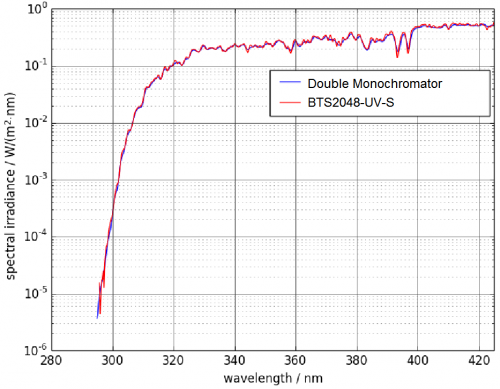
Figure 8: Comparison of the BTS2048-UV-S with a double monochromator. The sun edge can be resolved by up to 10E- 5 at a measurement time of 3 s (comparison with 90 s of the double monochromator).
4. Stray light suppression requirements depending on application
The requirements for stray light suppression vary for different applications. As explained in the previous chapter, good stray light suppression may introduce some complexity and cost. These should therefore be well matched to the specific application requirements. This chapter provides guidance several typical application areas.
4.1 Measurement of LEDs (e.g., Binning)
For most applications in which the measurement of monochromatic LEDs is necessary in the visible (VIS) range, standard stray light suppression using a high-quality spectroradiometer with good optical is enough. This can also be sufficient for the measurement of white LEDs if e.g. an accuracy of ±0.0020 of CIE1931 chromaticity coordinates (x,y) is sufficient. Measurements of white LEDs with and without mathematical stray light correction show that this accuracy of the color location can be improved by about 0.0005 through the correction. This means that in cases where precision is needed, mathematical stray light correction can be a good option.
4.2 Measurement of UV LEDs
For LED measurements spectroradiometers that are optimized for the visible spectral range are often used. Thus, their stray light suppression in the UV range is usually insufficient which results in large measurement uncertainties. However, the results of such measurements and the required stray light suppression depend on the intended application and the available boundary conditions. In a dark room or integrating sphere where just the UV LED is present the stray light influence might be less significant. However if there is ambient light present a sufficient stray light suppression is essential. This should especially be considered when measuring white LED with a non-negligible UV content. It is therefore recommended to use at least one of the stray light correction methods available for UV/VIS spectroradiometers. If applicable, a spectroradiometer that was specifically developed for the UV range should be used.
Note: In most cases, the responsivity of a pure VIS device is not ideal for the UV range which increases the measurement uncertainty. With the BTS2048-VL-TEC or BTS2048-UVVISNIR and mathematical stray light correction, Gigahertz-Optik offers a good universal device that is characterized by high responsivity and high stray light suppression, even in the UV range. This is perfectly supplemented by the BTS2048-UV, BTS2048-UV-2 and the BTS2048-UV-S for high-quality UV measurements.
4.3 General lighting
The same arguments as mentioned in section 4.1 apply to laboratory and production measurements. However, handheld measurement devices demand different measures. The need to keep these devices compact poses an extra challenge for the optical design in terms of stray light suppression. The very small size of “mini-spectrometers”, is not well suited for suppressing stray light and therefore can result in instruments that are unsuitable for precise color measurements.. However, they are ideal for fast, onsite test measurements, where the requirements are quite different. High- quality handheld devices have fully-fledged spectrometer units which match up well to laboratory instruments and provide accurate, onsite measurement result. These high-quality handheld devices should also be temperature-corrected and provide reproducible and stable measurement results!
Note: Gigahertz-Optik offers the corrected MSC15 mini-spectrometer, which perfectly meets all the requirements of a low-budget device. In addition, the BTS256-EF high-quality devices perfectly round off the portfolio of our handheld devices. These guarantee sufficient stray light suppression and support many extra features such as Wi-Fi and flicker measurements.
4.4 Solar measurement
For measurements of the sun and daylight, it is important to determine which parts of the solar spectrum are to be measured. If you only need information from VIS and NIR, the arguments from section 4.1 must be taken into account. However, if the UV range is of interest in particular, high- quality spectroradiometers that are optimized for the UV range are needed for UV index, erythema, and ozone measurements among others. In such applications, VIS universal devices quickly reveal their limits in terms of stray light suppression. This was confirmed by the publication by (Egli et al., 2016) among others. In addition, the devices must be temperature-stabilized and weather-proof since long measurement sequences are often required.
Note: The BTS2048-UV-S-WP, BTS2048-VL-TEC-WP and BTS2048-IR-WP from Gigahertz-Optik are devices that guarantee high-quality measurements for a wide spectral range – from deep UV up to NIR.
4.5 Radiation protection/occupational safety/high power UV measurements
The same arguments as those described in section 4.4 apply to this type of measurements. Sufficient stray light suppression is required to prevent any stray results, especially for erythema and ICNIPR measurements or evaluations regarding e.g. artificial optical radiation Directive 2006/25/EC or DIN EN 62471 photo biological safety.
5. Conclusion
In short, the effect that stray light has on the measurement uncertainty cannot be ignored. The method used for stray light suppression should be selected based on the respective application and its requirements. For instance, measurements in the UV range typically require more extensive suppression methods than in the VIS range. The extent of the stray light effect is a device specification and must be characterized by the manufacturer. In addition, the amount of stray light also depends on the spectral distribution of the light source being measured.
For users, a partner with comprehensive expertise, competent advice, and a coherent product portfolio with appropriate measurement technology e.g., tunable lasers (OPO) and an accredited calibration laboratory are essential.
See our BTS2048 Series which is worldwide used, accepted by industry, science and e.g. many NMIs.
6. References
Egli L, Gröbner J, Hülsen G, Bachmann L, Blumthaler M, Dubard J, Khazova M, Kift R, Hoogendijk K, Serrano A, Smedley A and Vilaplana J M 2016 Quality assessment of solar UV irradiance measured with array spectroradiometers Atmos. Meas. Tech. 9 1553-67
Nevas S, Wübbeler G, Sperling A, Elster C and Teuber A 2012 Simultaneous correction of bandpass and stray-light effects in array spectroradiometer data Metrologia 49 S43
Zong Y, Brown S W, Johnson B C, Lykke K R and Ohno Y 2006 Simple spectral stray light correction method for array spectroradiometers Appl. Opt. 45 1111-9
CIE 127, Measurement of LEDS
CIE 198, Determination of Measurement Uncertainties in Photometry
CIE 214, Effect of Instrumental Bandpass Function
CIE S025, Test Method for LED Lamps, LED Luminaires and LED Modules