3.2 Parameters of a Spectroradiometer
The following sections give information on:
Wavelength accuracy
The wavelength accuracy of a spectrometer is defined by a variety of quantities. In principle, the quality of the wavelength calibration presents the most important basis of its precision. For calibration purposes, intrinsic atomic transitions like the line spectra of Hg, Ar, Ne, etc. are used in most cases. Fabry-Pérot interferometers, so-called etalons, are currently also used in order to gain more precise information about the intermediate parts of the spectrum in between the emission lines. These physical emission lines have a very narrow FWHM and are almost undetectable by the spectral radiometers used in light engineering. This means that the lines seem to have a different width based on the bandwidth of the spectroradiometer. This can lead to an overlap of multiple lines particularly in the case of devices with a very broad optical bandwidth. These lines have to be interpreted for the calibration and the respective pixels of the spectrometer array mapped to a wavelength. Interpolation in between the determined sampling points is finally done. Here, it is vital to have enough sampling points over the entire spectrum of the spectrometer. Such an interpolation only offers limited precision. Extrapolation towards the pixels at the boundaries of the spectral range is critical and should be avoided if possible.
In terms of the precision of the calibration, the measuring task must also be taken into account. If for example a gas discharge lamp is supposed to be measured with many closely packed spectral lines (for instance 3 spectral lines with distances of 2 nm), it is impossible to resolve them with a spectrometer that has an optical bandwidth of only 10 nm. The precision is, among other things, limited via the optical bandwidth. In contrast to this, resolving the lines using a spectrometer that has a 2 nm bandwidth (see optical bandwidth) poses no problem at all.
The pixel resolution also has an effect on the wavelength accuracy. If a measurement device has a pixel size of 2 nm and an optical bandwidth of 2 nm, the good optical bandwidth can only be exploited in a limited way due to the small number of pixels. It is recommended to have the length of more than 3 pixels equal the optical bandwidth (see pixel resolution).
The wavelength accuracy, the optical bandwidth and the number of pixels generally have to match. Furthermore, the wavelength calibration over the whole spectral range has to be performed with sufficient precision using a sensible number of spectral emission lines or similar methods.
Absolute precision
The absolute precision of a spectral radiometer depends on the quality of the absolute calibration, the long-term stability of the measurement device, and hence also on the input optics. The quality of the calibration not only requires a certain calibration standard, but also the knowhow and a good equipment of the calibration facility. An absolute calibration is a very complex non-trivial matter.
Besides the calibration, the long-term stability of the measurement device is at least of equal importance since if such a device shows a drift of a few percent each year, it can only give reliable readings for a short amount of time. Since such changes happen over a long amount of time, they often end up unnoticed. Only a recalibration can make such ageing effects apparent. It is generally advisable to perform recalibrations on an annual basis. It might be necessary to perform the recalibration more than once per year if a measurement device shows stability issues. A side effect of this is that the devices are not available for use during recalibration procedures and machining time is lost. Device manufacturers often offer special “do-it-yourself” recalibration options (integrating spheres with calibration standards and software support). In some cases, calibrations on short notice are offered as well.
Basically, the surrounding environment, frequency of use, and storage conditions may influence device stability. Such influences determine the recalibration time cycle. Moreover, the full measurement system should also be taken into account in addition to the measurement device stability. For instance, the system can contain an integrating sphere whose coating might age. This again depends on the coating technology.
Reproducibility
A very high reproducibility of a spectral radiometer’s measurement is the basis for every accurate measurement. This is notably the case for sophisticated measurement tasks. The reproducibility depends on factors like stability of the measurement device, the calibration, noise, correction of environmental effects (like temperature), etc. For binning applications, the stability of the color coordinates may be used as a criterion. A good spectral radiometer provides for example a reproducibility of the x, y coordinates of 0.0001 to 0.0002 for typical white light LEDs.
Pixel resolution
When CCDs or CMOS detectors are utilized in a spectral radiometer, each pixel represents a wavelength. The mapping is defined when calibrating the device’s wavelength. At least 3 pixels are necessary; more than 5 pixels are recommended for each bandwidth function of the spectral radiometer. This means that a device with a 2 nm bandwidth should have a pixel size of 0.6 nm or higher. The total number of pixels depends on the spectral range to be measured. A spectral radiometer which spans a wavelength range from 280 nm to 1000 nm at a bandwidth of 2 nm should at least have
( 1000 nm - 280 nm × 5 = 1800 ) pixels 2 nm
Optical resolution / bandwidth
The optical bandwidth determines how precise an optical line (like the line spectrum of Hg / Ar) can be measured. Below the optical bandwidth, no spectral details can be resolved by the measurement device. Technically speaking, the optical bandwidth is mainly determined by the combination of the entrance slit, optical grating, and the imaging quality of the device. In the spectrometer, the entrance slit is imaged onto the detector. Depending on the spectral range of the device, this determines the optical bandwidth since the size of the entrance slit’s image on the detector equals the optical bandwidth in nanometres. This dependency of the bandwidth on the size of the entrance slit can be exploited to modify the device’s bandwidth. Smaller bandwidths offer a more precise resolution of the measurement data but also cause a reduction in signal intensity thus resulting in longer measurement durations. In other words, the optical bandwidth should be matched to the respective application. In general, bandwidths of 5 nm or below are recommended. Bigger bandwidths should only be used if broadband illumination sources are measured or if a mathematical bandwidth correction is applied to the data. Figure 1 shows a line spectrum (of an intrinsic line source) sampled at varying bandwidths. The higher the optical bandwidth is, the broader the sources’ spectral peaks are. In addition, their peak intensity also decreases. In the case of broadband sources or, in other words, at multiples of the optical bandwidth, these effects can no longer be defined in such a defined manner.

Fig. 1: Effect of the optical bandwidth on a measurement of line spectra
Mathematical bandwidth correction
Different approaches are currently used for mathematical bandwidth corrections. The easiest to implement is the Stearns and Stearns approach [2]. It produces satisfying results but the optical behavior of the measurement device itself cannot be taken into account since the approach assumes a triangular band-pass function. This is largely not the case for an actual measurement and only an inferior quality of the correction can thus be realized.
Ohno and Woolliams refined this methodology in such a way that allows for the measurement and direct correction of the device’s band-pass function. These methods have established themselves in the meantime, with the method by Woolliams et al. (2011) [3] being recommended by CIE.
Figure 2 shows a bandwidth-corrected measurement of an LED at a 5 nm bandwidth. If a bandwidth correction is applied, the spectral distribution of the corrected data sets overlap with the reference measurement that was recorded at a bandwidth of 0.5 nm. In other words, bandwidth errors can be reduced or even eliminated using such a mathematical correction.

Fig. 2: Bandwidth-corrected measurement
Stray light
The topic of stray light is a rather complex one and cannot be easily summarized. Nonetheless, it is very helpful to understand the causes and effect of stray light. In a simplified manner, one can say that each kind of signal that does not represent the spectrum of the light source under test can be evaluated as stray light. Such signals may for example be caused by scratches on optical surfaces, inter-reflection within the device, grating ghosts, minor quality optical surfaces, etc. There are multifaceted causes that heavily depend on the spectral range. A good spectroradiometer should at least have a stray light suppression of 3 to 4 orders of magnitude. Here, the effects on later applications also have to be taken into account. If for instance measurements in the UV-VIS spectral range are pursued, a high quality stray light correction is required in order to visualize the large dynamic of the measurement. The typically much more pronounced visible signals may worsen the detection limit in the UV range in such a manner that these signals disappear under the stray light contribution. This means that stray light in the visible range produces a certain number of counts per pixel in the UV range which possibly makes the weak UV signal undetectable. In the visible spectral range, this issue may be much less critical since the dynamics of the measured signals is different.
Nonetheless, this topic should still be considered and ideally, a spectral radiometer with only a weak stray light level, or even a radiometer with a mathematical bandwidth correction, selected.
A variety of mathematical stray light correction algorithms can be applied. In case of less complex methods, color filters e. g. that block the UV-VIS signal can be used. This would mean that any remaining signal in this spectral range has to be attributed to stray light. This contribution can be subtracted from later measurements. This method enables a limited but simple and quick option of taking stray light into account.
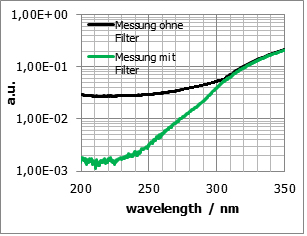
Fig. 3: Stray light correction by subtraction
Much more complex and taxing methods are the methods by Zong et al. (2006) [4] and Nevas et al. (2012) [1]. In order to apply these methods, the spectral radiometer has to be scanned and characterized using a tunable laser; in other words, the device is excited using a single wavelength and the spectral response function recorded. If this is performed using a large number of wavelengths, this methodology can be used to characterize the device over the whole spectral range. This means that the so-called line spread function (LSF) is measured and applied for the corrections.

Fig. 4: LSF function of an array spectrometer
Figure 5 shows an uncorrected and a corrected measurement. The results can be improved by about a whole order of magnitude depending on the type of measurement. The LSF method is device-dependent and has to be determined individually for each measurement device. This increases the complexity of this method.

Fig. 5: Stray light corrected LED measurement
Linearity
Linearity is one important property of a spectroradiometer. If a measurement device behaves in a linear manner, a signal x causes a certain number of registered counts y and a signal 100 * x does not cause 97 * y but 100 * y instead. This is a crucial property since if a measurement device does not behave linearly, the measurement uncertainty will be dependent on the input signal. This is the reason why a high quality linearization over the full dynamic range of the device is very important. In most cases, this is performed by mathematical means by means of a linearity calibration curve. Gigahertz-Optik has developed the BTS technology for this purpose. Parallel to measurements with the spectroradiometer, a second set of measurements is performed using a linear diode whose linearity can be used to linearize the spectrometer.
Dynamic range
Most analytic spectrometers are not perfectly suited for light measurements. In this field, many applications span some decades of dynamics and hence the need for specifically designed measurement devices. This kind of dynamics is physically based on the fact that visual sensations are interpreted by the human eye on a logarithmic scale and as a result, the lighting situation in our everyday lives is also subjected to considerable dynamics. Furthermore, measurement devices are typically calibrated at certain intensities that do not have to correspond to their later application. Besides the very good linearity properties, a considerably broad dynamic range of the measurement device is also required. This also takes into account the spectral distributions of luminaires like LEDs or CFLs. These massive requirements have to be fulfilled by measurement devices. In addition to the detector’s optical design – CCDs typically have a broader dynamic range than CMOS – the electronics also play a decisive role in determining the dynamic range. Optical density filters are often used to further increase the dynamic range.
Dark signal subtraction
Besides the linearity, wavelength accuracy and stray light, the quality of dark signal subtraction is also of utmost importance when performing measurements using a spectroradiometer. In other words, no signal should be detected by a spectroradiometer if there is no input signal. However, typical CCD and CMOS chips show the so-called base or dark signal. This largely consists of electronic and thermal noise. The signal level rises as the integration time increases – the increase is temperature-dependent. In order to ensure accurate measurement results, the dark signal has to be measured and subtracted from the actual light measurement.
For this to be effective, the dark signal has to be very stable i. e. the light measurement signal must not change during the time between dark and light measurement in order to avoid residual errors after the subtraction.
Furthermore, the dark signal should be kept as small as possible. This can be achieved by cooling to prevent the increase of the dark signal over time. As a rule of thumb, a temperature reduction step of 7° C halves the noise. A stable cooling system can therefore be recommended for a spectroradiometer that is designed for the measurement of small dark signals. This is however a very complex task. The cooling system has to be very stable in order to avoid errors that are induced by temperature changes between the dark and light measurement. A more attractive and elegant solution is offered by extremely short measurement durations. This ensures the dark signals remain low thereby minimizing their influence. Short measurement durations can be achieved by using sensitive back-thinned CCD chips as well as an optical design with a high signal throughput.
In general, each spectroradiometer, whether actively cooled or not, should be given a sufficiently long warm-up-phase in order to ensure it reaches a thermal equilibrium. Only then can stable dark signals be ensured.
Baseline noise
Baseline noise is generally defined as the noise that remains when a dark measurement is subtracted from a signal-free light measurement. This level should consist of a very low number of counts and should remain stable at a constant temperature thus making it possible to use one measurement device for multiple light measurements after a dark measurement. This is an important requirement for the stability of the device. Special spectroradiometers for outdoor measurements must either integrate correction options for temperature variations or allow for very fast dark measurements.
With respect to noise, the question about the number of counts that are required for a good measurement becomes significant as well. It is not possible to give a general answer. Basically, one can say that it primarily depends on the ADC of the spectroradiometer. A 12 bit ADC therefore has a resolution of 4096 counts whereas a 16 bit ADC offers a resolution of 65536 counts. The 16 bit ADC is preferable since it offers a finer resolution. However, a 12 bit ADC may be sufficient depending on the application. The number of counts for a good measurement mostly depends on the signal-to-noise-ratio of the spectroradiometer. If such a device has a baseline noise of 2 counts, measurements with 2000 utility counts can be performed at a SNR of 100. If the noise level is 20 counts, 20000 counts would be required for such a SNR - which is impossible using a 12 bit ADC. In other words, for the interpretation of the noise level, the resolution of the ADC has to be taken into account. A single count of noise with a 12 bit ADC is equivalent to 16 counts of noise with a 16 bit ADC.
Input optics
The composition of the input optics has to be customized for the specific application. For example, measurement of the irradiance requires a high-quality cosine diffuser. For measurements involving integrating spheres, the input optics of the spectroradiometer should be placed at sphere level in order to comply with the LM-79 among other recommendation. For the measurement of the average LED intensity type A or B, specific input optics or measurement adapters are required.
In general, the more stable the design of the input optics and its fitting to the spectrometer is, the more stable will be device’s calibration be. This is of particular importance when a device is used in multiple measurement geometries and has to be modified often. Here, the adapters and other components have to be designed such that they are mechanically and optically reproducible.
Averaging
In order to reduce measurement noise, multiple measurement repetitions and averaging are a common choice. The disadvantage of this method is the multiple measurement duration in respect to the averaging.
Another methodology is to measure neighboring pixels and calculate a weighted average. This leaves the measurement duration unchanged since only a single measurement is required. However, it results in a bandwidth increase and should therefore be performed only with wide spectra.
Interpolation
The resolution of a measured data point is defined by the pixel resolution of the array. Between these points, interpolation is possible without any issues as long as the pixel resolution is significantly larger than the optical resolution. There are several interpolation methods, with the spline interpolation being the most common one.
Software
Besides a good spectroradiometer, a good application software is also important. Among others things, it has to be well suited for spectral analyses, determination of typical measurands, and should also allow for a flexible measuring process. It should include functions such as substitution correction, re-calibration and data export in common formats like IES or EULUMDAT for use with a goniometer. The application software should be intuitive and should support application-specific tools.
Besides this extensive requirement profile for an application software, a software development kit (SDK), which supports implementation of measurement device functions into an existing software, is often necessary. In other words, programming access to device functions should also be possible. The software should not have any restrictions in order to prevent application limitations.
Data transfer
In addition to optical parameters, data transfer duration is also an important characteristic. Data from fast measurements has to be available fast. USB and Ethernet connections are established for data transfer, where Ethernet is preferred in highspeed binning.
BTS technology
Spectroradiometers often have linearity issues. Low priced CMOS chips, especially such chips that are not designed for spectroradiometry, are nonlinear. Even the more expensive CCDs do have certain nonlinearities and instabilities. These nonlinearities can be corrected mathematically; but the stability (e. g. of the integrated photometric quantities) cannot be compared with that of a diode. BTS technology strives to combine all advantages of all components. On the one hand, spectral data from spectroradiometry is used to correct the diode’s spectral error correction coefficient. The diode’s linearity is on the other hand used to correct the data from the CCD or CMOS chip. Both sensors can therefore correct each other very well. Furthermore, BTS devices are advantageous in that continuous (CW) measurements can be done very fast using the diode e.g. in flicker or transient measurements. This is not possible with a spectroradiometer. BTS technology generally enables additional measurement options that are impossible with “normal” spectroradiometers. It is important to keep in mind that in the case of BTS technology, each sensor – the diode as well as the spectroradiometer – is a self-contained measurement system that can be used without the other one.
Guideline for spectral measurements (in regards to applications)
Measurements with a spectroradiometric handheld device
Besides the optical properties, the compactness, robustness and speed are also important for spectroradiometric measurements. In other words, a hand-held has to be able to withstand a certain amount of mechanical stress and also allow sufficiently fast measurements through a high spectral sensitivity. Many applications in which hand-held devices are used are not stable over time. In addition, the movement of the measurement device causes measurements errors. The device should be compact-built to make it ideal for mobile applications and allow for application flexibility. In terms of optical properties, a correction of environmental effects like temperature is also important besides the known photometric parameters. Here, a stable and easily correctable diode, which can correct the spectrometer in return, is recommended. This is for instance taken into account in BTS technology.
Measurements using a spectroradiometric laboratory apparatus
Measurements using a laboratory apparatus require certain flexibility. Such a device should not be limited to a single measurement function; instead, low priced enhancements should increase the number of functions. It is for this reason that a spectroradiometer can be utilized for illuminance measurements by adding a COSdiffuser or for measurement of the total luminous flux by combining it with an integrating sphere. In combination with the COS-diffuser, it can also be used as an illuminance detector head for a goniometer. For this purpose, modularity of the manufacturer is important in order to minimize the additional costs required for the large number of additional measurement devices.
Measurements using an industrial spectroradiometer
Long-term stability, precision and easy integration of the measurement device into a process are often important for industry-grade measurements. This integration refers to both mechanical integration and software implementation. An easy-to-use SDK (Software Development Kit) with extensive control opportunities of the measurement devices is therefore important. Additionally, high data transfer rates – faster than 10 ms for a full data set if possible – as well as extensive triggering options are necessary. In terms of optical properties e.g. in the context of binning, a good wavelength accuracy of ± (0.2 − 0.5) nm, an optical bandwidth between (2 − 5) nm, linearity (e. g. using a linear integral detector), a low stray light contribution (at most 10 − 3 or better), as well as a stable and precise absolute calibration are required. High sensitivity, which can be achieved by using back-thinned CCDs for short measurement durations, and a low noise contribution for good reproducibility are also advantageous. Additionally, a certain modularity and versatility of the manufacturer is helpful as this allows for the matching of optical measurement instruments in an ideal way depending on the measurement situation. For this purpose, standard products like integrating spheres, measurement adapters and the like should be available.
[1] Nevas S, Wübbeler G, Sperling A, Elster C and Teuber A 2012 Simultaneous correction of bandpass and stray-light effects in array spectroradiometer data Metrologia 49 S43
[2] Stearns E I and Stearns R E 1988 An example of a method for correcting radiance data for bandpass error Color Res. Appl.13 257
[3] Woolliams E R, Baribeau R, Bialek A and Cox M G 2011 Spectrometer bandwidth correction for generalized bandpass functions Metrologia 48 164
[4] Zong Y, Brown S W, Johnson B C, Lykke K R and Ohno Y 2006 Simple spectral stray light correction method for array spectroradiometers Appl. Opt. 45 1111-9